AI MONITORING · SECOND SPHERE
AI Monitoring.
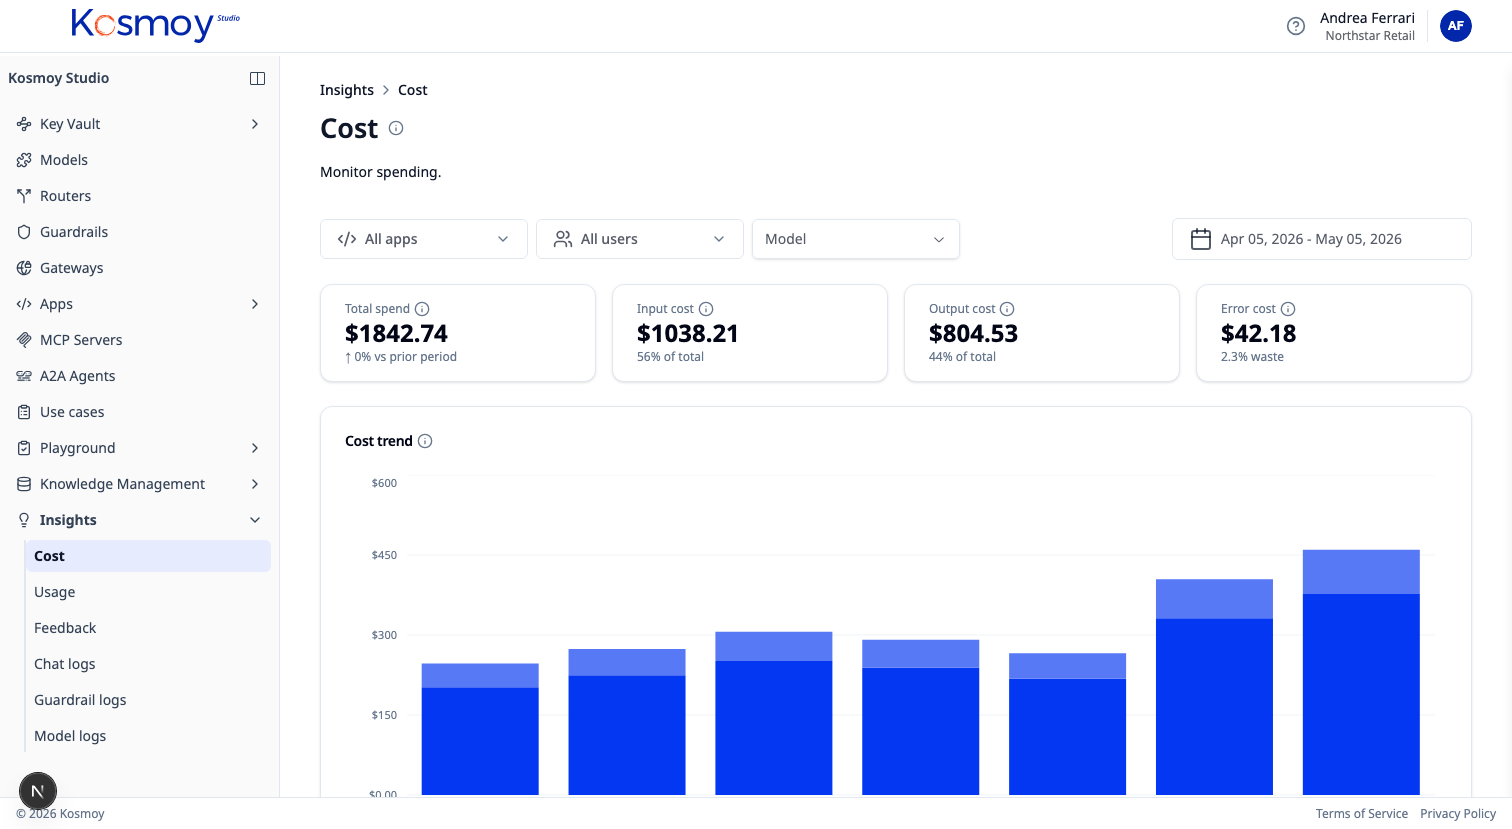
Every AI call observed. Cost, usage, user feedback and guardrail alerts in one dashboard, across every app and provider.
When AI runs across many apps, teams and providers, the only way to manage it is to see every call. Kosmoy logs them all and breaks the picture down by app, team, model, use case and time.
Cost is usually the first question — frontier-vs-small-model spend can be two orders of magnitude apart. Quality is the second — user feedback connects to prompts and models. Risk is the third — guardrail alerts roll up the same way.
Module questions, answered straight.
What does AI Monitoring actually log?
Every LLM, MCP and agent call routed through Kosmoy — prompt, model, latency, cost, user feedback, guardrail event. Broken down by app, team, model, use case and time.
Can it see calls that don't go through the Gateway?
No. Calls made directly to a model provider don't appear in the dashboard. The remediation is to bring the call into the Gateway path.
How does it integrate with our observability stack?
Kosmoy emits structured events that ship to Splunk, Datadog, Grafana, Snowflake and similar pipelines. The Insights Dashboard is the AI-native view; your APM stack stays the long-horizon home for cross-correlation.
See AI in production, not just AI in pilots.
Walk through the dashboard with real cost, quality and risk data.