AI MONITORING · SECOND SPHERE
Cost, quality, and risk signals for every AI application.
AI systems change over time. Usage grows. Models get updated. Prompts drift. Costs rise. Insights gives the AI team the operational signals they need — not just the ones the model provider chose to expose.
Most enterprises operating AI in production today see a fraction of what’s happening. The model provider’s console shows token counts; the application’s own logs show errors; cost reports come from finance once a month. None of that is enough to operate AI well.
Kosmoy’s Insights Dashboard collects five signals across every governed AI app — cost, usage, feedback, performance, policy events — and connects them. Find the application using the wrong model. Move simple workloads to a smaller model. Watch quality through user feedback. Catch a guardrail event before it becomes a headline.
Five signals.
Signal
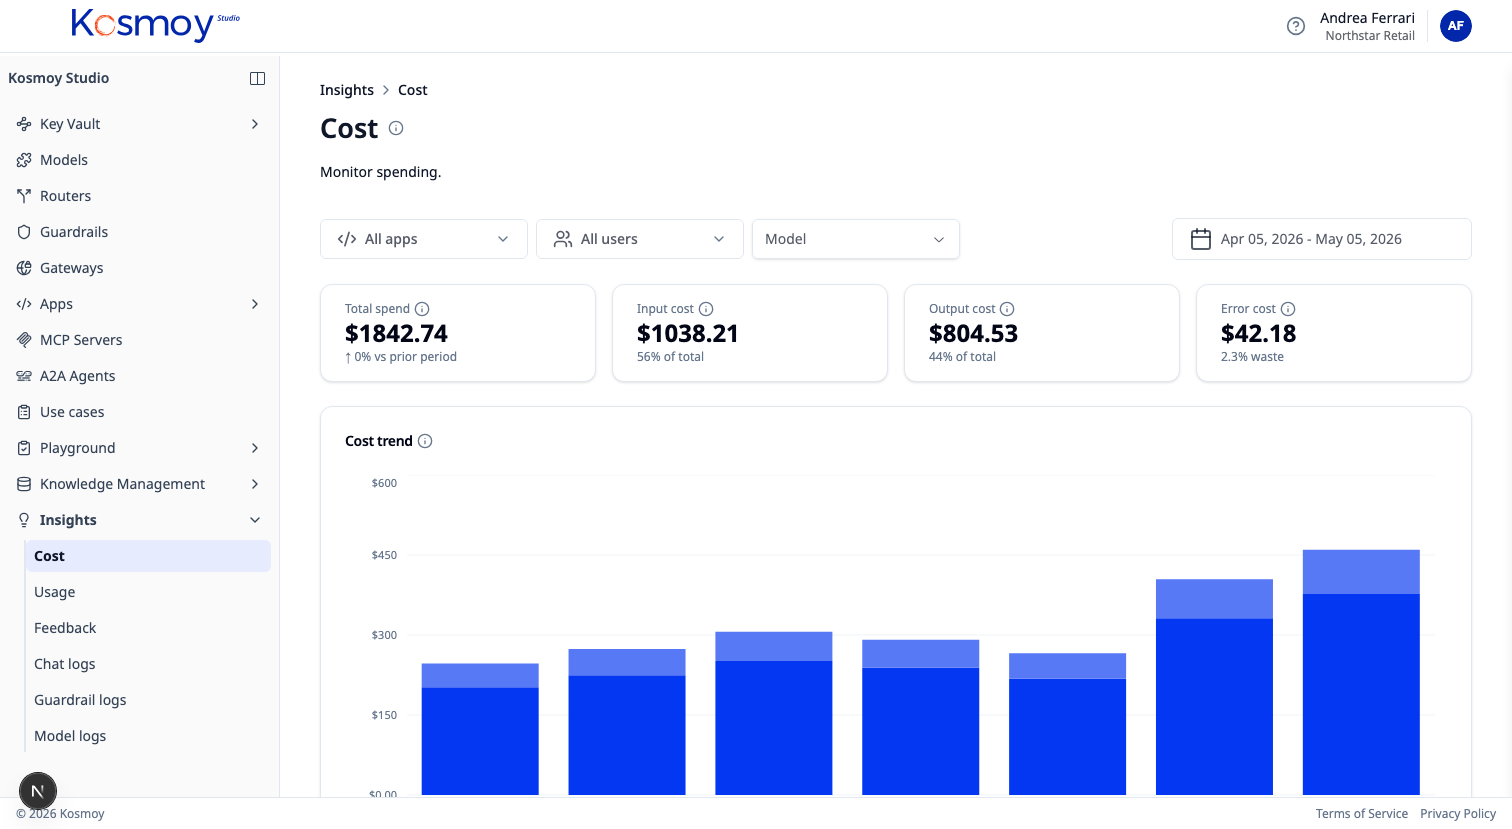
Cost
Spend by model, provider, app, team, use case, time period. Average cost per call. Cost evolution. Forecasts based on the last 30 days.
Signal
Usage
Requests, tokens, users, tools called, agents invoked, environments. Adoption curves. Active vs idle assistants.
Signal
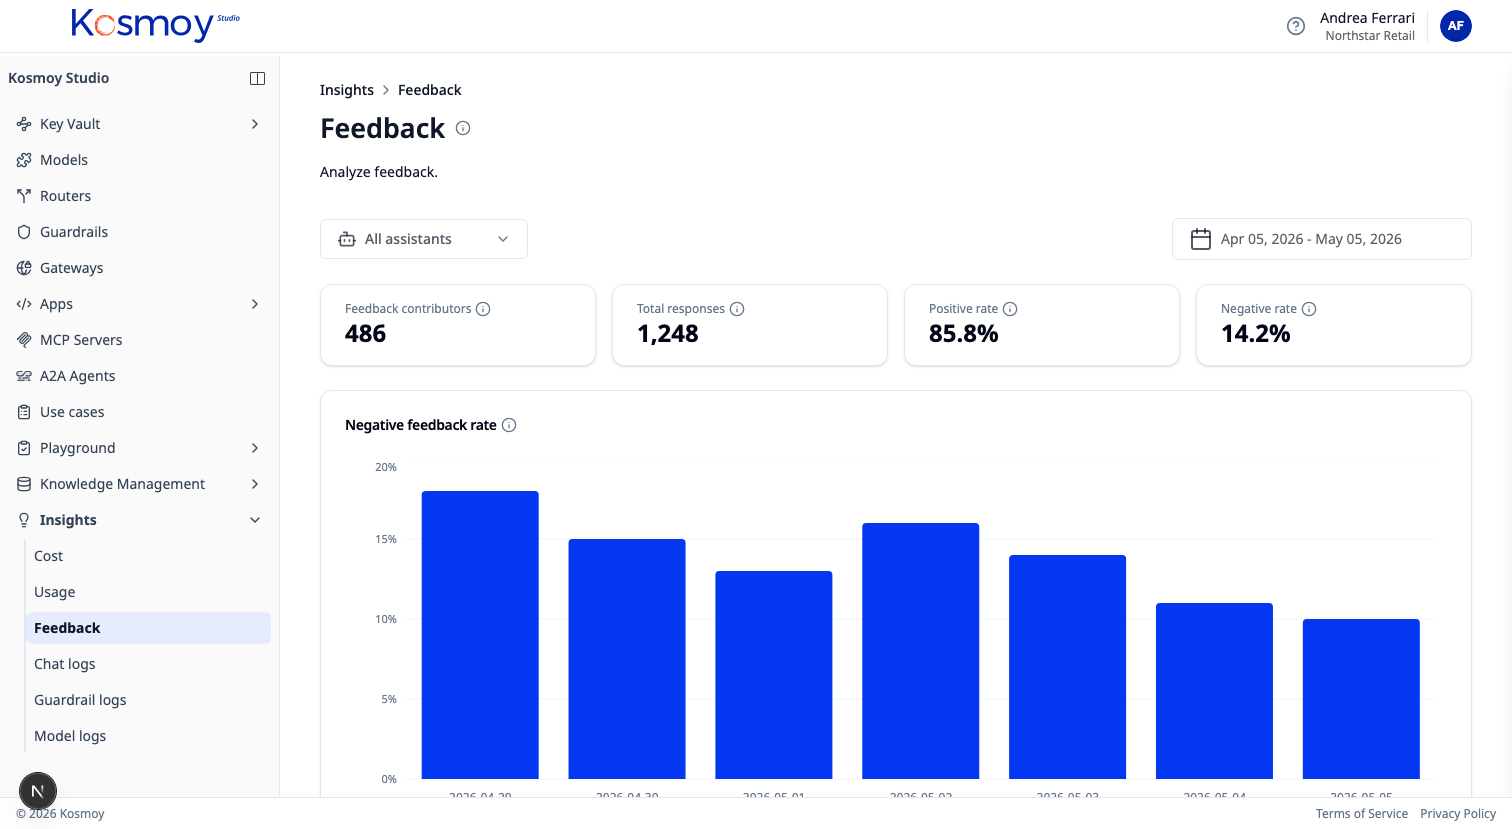
Feedback
Positive and negative user feedback connected to prompts, models, retrievers, applications. Drill into the negative-feedback set.
Signal
Performance
Latency. Errors. Fallback events. Model comparisons (the same prompt across models — quality vs cost vs latency).
Signal
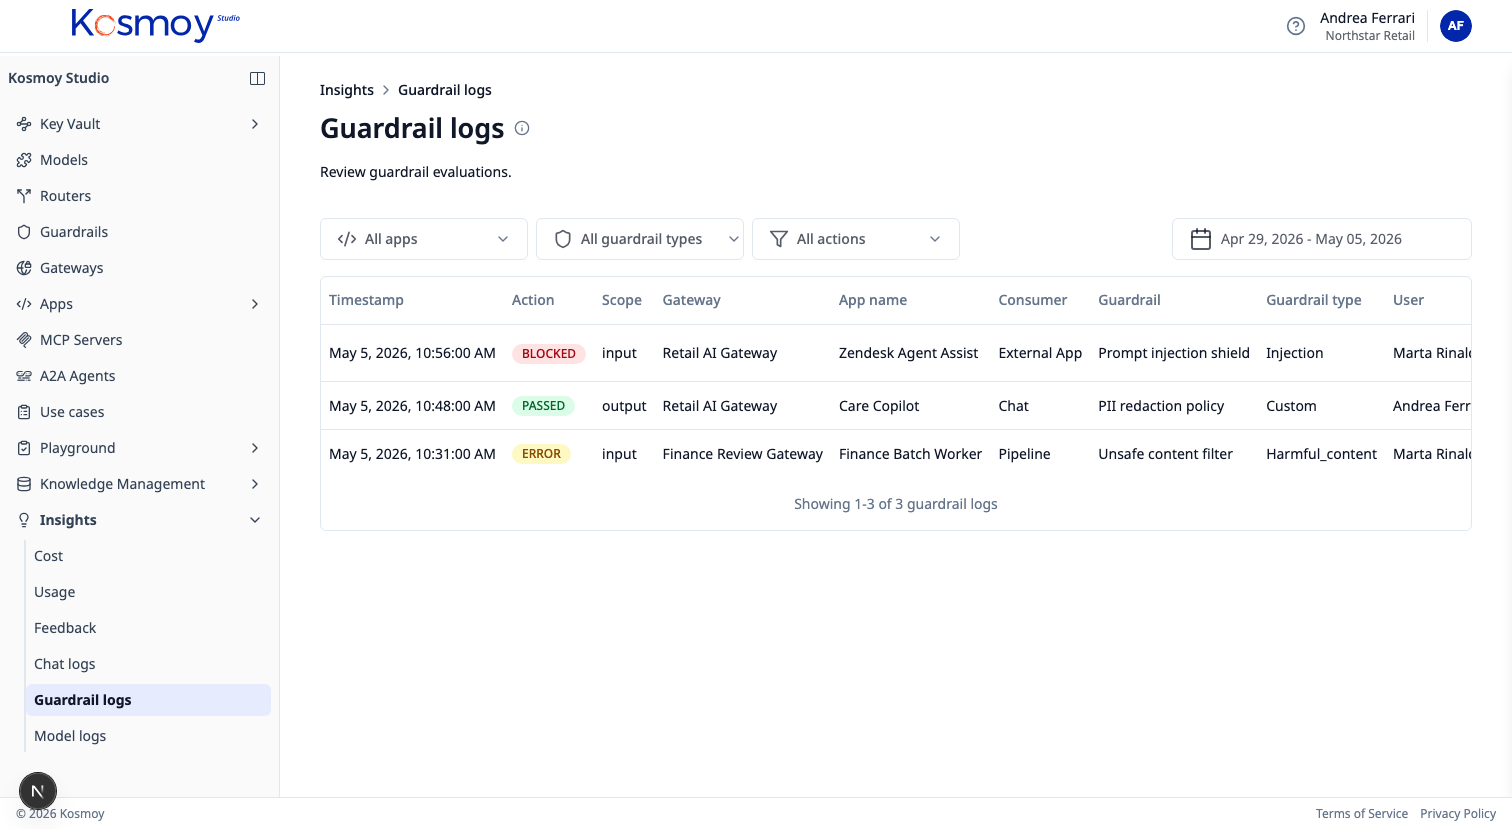
Policy events
Toxic language. PII. Prompt injection. EU AI Act risk hits. Custom guardrail triggers. Each event searchable, exportable, linked to a use case.
The optimization loop
Find. Move. Watch. Keep — or roll back.
Find the application using GPT-4o for one-line replies. Route those requests to a small fine-tuned model. Watch user feedback. Watch error rates. Keep the cheaper route only if quality holds.
What the dashboard covers
- Every call routed through a Kosmoy AI Gateway
- Every agent run inside a Kosmoy Action Capsule
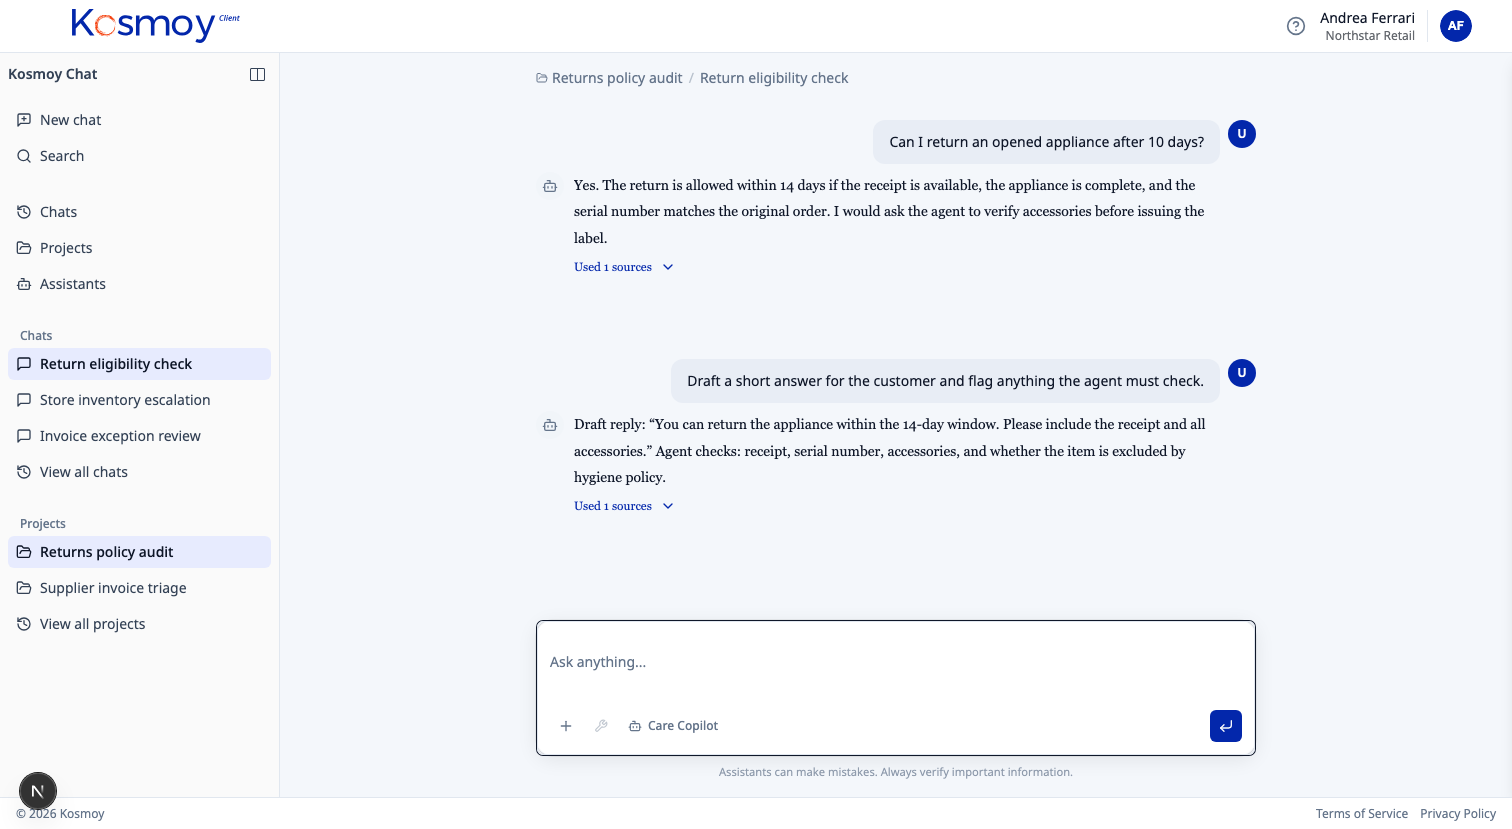
- Every Kosmoy Chat thread
- Every QA session in the Agent Builder
- Every guardrail decision
What it cannot see
- Calls made directly to a model provider, not through a Kosmoy Gateway. Those don’t exist for the dashboard.
- Agents on third-party platforms. Kosmoy can read upstream telemetry where the platform exposes it; otherwise it stays at the inventory level.
Remediation in both cases: bring the call into the Gateway path.
Module questions, answered straight.
How granular is the cost data?
Per call. Aggregated per app, team, use case, model, provider, environment, time period. Exportable as CSV or available via API.
Does it work without an Action Capsule?
Yes. The Gateway alone produces all the signals — Capsule deployment is optional.
Where does the data live?
Inside Kosmoy, in the customer environment. Default retention is configurable. Exports are first-class.
Can it integrate with our existing observability stack?
Insights forwards structured events to Splunk, Datadog, Grafana, Snowflake, and similar. The Kosmoy dashboard is the operational view; downstream tools handle long-horizon analytics.
What about user feedback signal quality?
Feedback is a raw signal — thumbs up/down, plus structured rating. It's most useful when correlated with cost, model, and prompt version. The dashboard does that correlation by default.
See AI in production, not just AI in pilots.
Walk through the dashboard with real cost, quality and risk data.